6/12/2017
M 3.2 - 14km NNE of West Yellowstone, Montana
By: Gordon Rutherford
M 3.2 - 14km NNE of West Yellowstone, Montana
UTC Time = 2017-06-12 22:54:55
Magnitude = 3.2m
Location = 44.783°N 111.039°W
Depth = 10.6 km
Drivers:
Jupiter after Rise, at Eastern Lunar Elongation
- Moon at Median (Antipodal Skyview)
Epicenter Skyview
Antipodal Locations
Antipodal Skyview
NOAA Geomagnetic Polarity
NASA JPL Data
M 5.0 - 253km SSE of Saparua, Indonesia
By: Gordon Rutherford
M 5.0 - 253km SSE of Saparua, Indonesia
UTC Time = 2017-06-12 15:46:47
Magnitude = 5.0m
Location = 5.609°S 129.688°E
Depth = 34.1 km
Drivers:
Sun at Antipodal Median, during Moon at 150 degrees from the Sun
- Earth/Moon in the Neutral to Positive Rotating Solar Magnetic Field
Epicenter Skyview
Antipodal Locations
Antipodal Skyview
NOAA Geomagnetic Polarity
NASA JPL Data
M 5.1 - 82km NE of Tilichiki, Russia
By: Gordon Rutherford
M 5.1 - 82km NE of Tilichiki, Russia
UTC Time = 2017-06-12 15:06:27
Magnitude = 5.1m
Location = 60.967°N 167.207°E
Depth = 18.9 km
Drivers:
Uranus at Western Lunar Elongation
- Moon at Median
- Jupiter and Uranus at Geocentric Opposition
Epicenter Skyview

NOAA Geomagnetic Polarity
NASA JPL Data
M 6.3 - 4km S of Plomarion, Greece
By: Gordon Rutherford
M 6.3 - 4km S of Plomarion, Greece
UTC Time = 2017-06-12 12:28:38
Magnitude = 6.3m
Location = 38.932°N 26.364°E
Depth = 10.4 km
Drivers:
Jupiter at Eastern Lunar Elongation, during Jupiter Rise
- Moon at Median (Antipodal Skyview)
NOAA Geomagnetic Polarity
NASA JPL Data
Epicenter Skyview
Antipodal Locations
Antipodal Skyview
Solar Wind Data
6/11/2017
Solar Wind Report - 06/11/2016
By: Gordon Rutherford
Solar Wind Report
- Noticed a steady increase in solar wind data today
SPEED = 394 km/s
NOTE:
Solar Sector Boundary Crossing approaching on Jun 15/16th, based on NOAA Forecasting, shared in this post.
:Product: Forecast Discussion
:Issued: 2017 Jun 11 1230 UTC
# Prepared by the U.S. Dept. of Commerce, NOAA, Space Weather Prediction Center
#
Solar Wind (24 hr Summary)
Solar wind parameters continued at nominal levels with solar wind speed between 266-305 km/s. Total field ranged from 2-7 nT while the Bz component was between +4/-6 nT. Phi angle was variable throughout the
period.
.Forecast...
Solar wind parameters are expected to persist at background levels under a nominal solar wind regime through day one into day two (11-12 Jun). By mid to late on 12 Jun through day three (13 Jun), a slight enhancement in wind parameters is expected as remnants of a recurrent, positive polarity CH HSS rotate into a geoeffective position.
6/10/2017
M 4.6 - 107km NNW of Hirara, Japan
By: Gordon Rutherford
M 4.6 - 107km NNW of Hirara, Japan
UTC Time = 2017-06-10 22:13:33
Magnitude = 4.6m
Location = 25.711°N 124.925°E
Depth = 131.9 km
Drivers:
Jupiter approaching Eastern Lunar Elongation (Antipodal Skyview)
- Mars rise (Negative Rotating Solar Field)
- Earth/Moon in the Negative Solar Magnetic Field
Geocentric Data
NASA JPL Data
NOAA Geomagnetic Polarity
Epicenter Skyview
Antipodal Locations
Antipodal Skyview
M 5.1 - 75km SW of Puerto Madero, Mexico
By: Gordon Rutherford
M 5.1 - 75km SW of Puerto Madero, Mexico
UTC Time = 2017-06-10 18:47:35
Magnitude = 5.1m
Location = 14.321°N 92.986°W
Depth = 50.6 km
Drivers:
Mars at Lunar Opposition
Solar Magnetic Field
Earth/Moon = Negative (Solar Wind)
Mars = Negative to Neutral (Forecasted)
- based on magnetic polarity of the rotating solar wind at the earth/moon and mars, compared to the geomagnetic polarity of the epicenter location
NOAA Geomagnetic Polarity
NASA JPL Data
Epicenter Skyview
Antipode Locations
Antipodal Skyview
M 4.7 - 178km W of Port Hardy, Canada
By: Gordon Rutherford
M 4.7 - 178km W of Port Hardy, Canada
UTC Time = 2017-06-10 20:38:22
Magnitude = 4.7m
Location = 50.744°N 129.951°W
Depth = 12.0 km
Drivers:
Saturn at Lunar Conjunction (Antipodal Skyview Median)
- Earth crossing Saturn's connected path to the sun
Solar Magnetic Field
- Earth/Moon in the Negative
- Mars in the Negative
Epicenter Skyview
Antipode Locations
Antipodal Skyview
NOAA Regional Geomagnetic Polarity
NASA JPL Data
6/08/2017
EMSC Earthquake Analysis - 06/08/2017
By: Gordon Rutherford
EMSC DATA downloaded
DATE 06/08/2017
TIME 23:29:54 UTC
Number of quakes >2.5m 45
Highest Magnitude Quake
Depth = 40
Magnitude = 5.6
UTC Time = 23:23:47
MARIANA ISLANDS REGION
Deepest Quake
Depth = 543
Magnitude = 4.7
UTC Time = 21:54:07
SOUTH OF FIJI ISLANDS
2.5m 2
3m 26
4m 13
5m 4
6m 0
7m 0
8m 0
9 +m 0
Depth KM | # | |
Surface | 0-5 | 9 |
28 | 6-15 | 18 |
16-25 | 1 | |
Deep | 26 - 50 | 6 |
17 | 51 - 99 | 4 |
100 - 199 | 6 | |
200 - 299 | 0 | |
300 - 499 | 0 | |
500 + | 1 |
EMSC UTC Times for all quakes >2.5m
EMSC Earthquake Distribution
UTC Times converted to Epicenter Local Times
NASA JPL Data combined w/ EMSC EQ's >2.5m last 24 hours
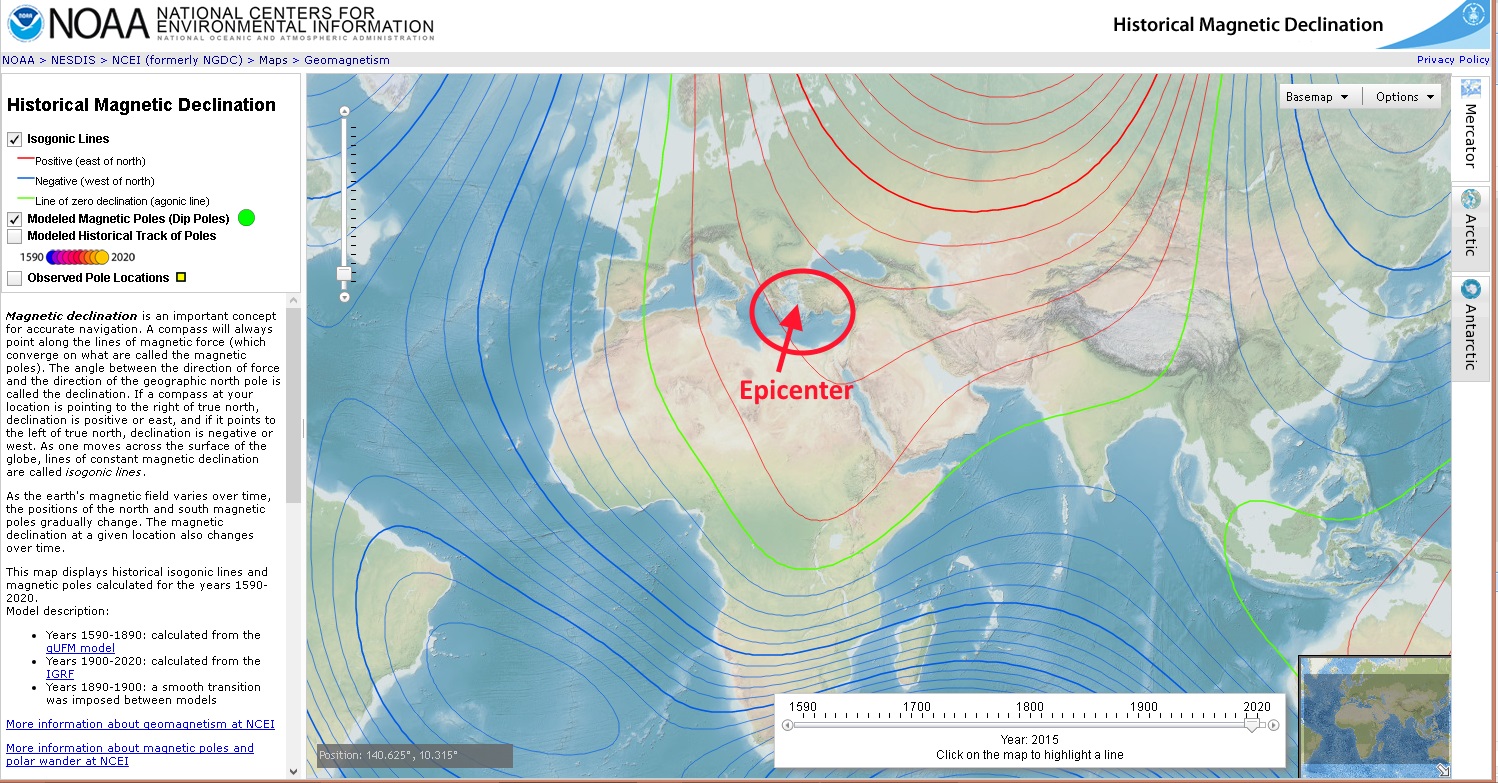
Geomagnetic Locations by Epicenter
NOAA Geomagnetic Earthquake Distribution
NASA JPL Data for today
NASA JPL Data - FORECASTED
Subscribe to:
Posts (Atom)