10/19/2017

M 5.8 - 168km E of Naze, Japan


By:  Gordon Rutherford

M 5.8 - 168km E of Naze, Japan
UTC Time = 2017-10-19 09:02:01
Magnitude = 5.8m
Location = 28.321°N   131.202°E
Depth = 10.0 km

COMBINATIONAL DRIVER:
Saturn (Neutral) at W. Elongation from Neptune

LUNAR DRIVERS:
- Neptune (Negative) at 150 degrees from the moon

ROTATING SOLAR MAGNETIC FIELD:
- Moon/Earth in the Neutral-to-Negative 


Geomagnetic Polarity


Epicenter Skyview

Antipodal Locations

Antipodal Skyview

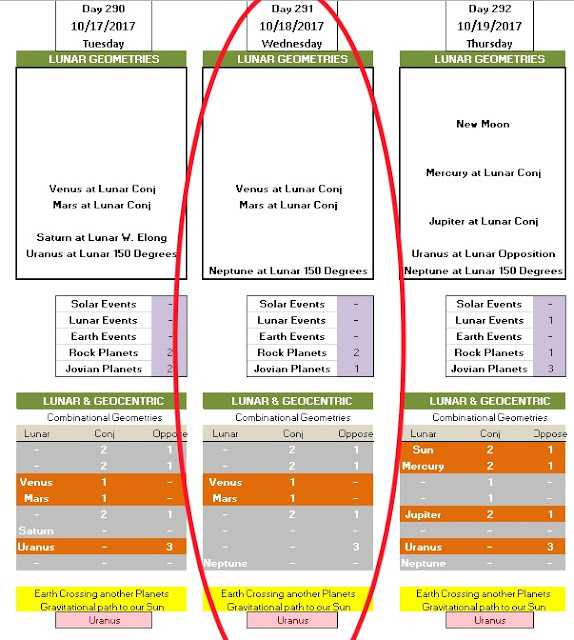
NASA JPL Data - Lunar Geometries

LUNAR + COMBINATIONAL DATA


Combinational Data

NOAA Solar Wind Data

NASA JPL and Solar Wind Data - Oct 19th, 2017


By:  Gordon Rutherford


Lunar Geometries
New Moon (Sun at Lunar Conjunction)
Mercury at Lunar Conj
Jupiter at Lunar Conj
Uranus at Lunar Opposition
Neptune at Lunar 150 Degrees

Combinational Geometries
- Earth crossing Uranus connected path to the Sun
- Jupiter and Uranus at Geocentric Opposition
- Jupiter, Sun, and Mercury at Geocentric Conjunction
- Saturn at Western Elongation to Neptune
- Sun and Neptune at Heliocentric Opposition

Rotating Solar Magnetic Field
- Mercury (Dia-Magnetic) in the Negative
- Earth(Crust Para-Magnetic) Neutral to Positive
  / Moon (Para-Magnetic) Neutral to Positive
- Mars (Para-Magnetic) in the Negative


Global N. Hemisphere Avg Tide Times

Tidal Heights

10/18/2017

M 6.0 - 100km SSE of Pangai, Tonga


By:  Gordon Rutherford

M 6.0 - 100km SSE of Pangai, Tonga

UTC  Time = 2017-10-18 12:00:59 
Magnitude = 6.0m
Location = 20.598°S   173.895°W 
Depth = 10.0 km

DRIVERS:
Approaching Lunar Opposition to Uranus
- Regional swapping occurring, Uranus not regular driver 

NOTES:
Uranus at Median (Epicenter Skyview)
Jupiter at Median (Antipodal Skyview)

Jupiter and Uranus at Geocentric Opposition


NOAA Geomagnetic Polarity (RED)

Epicenter Skyview

Antipodal Locations

Antipodal Skyview

NASA JPL Data

10/13/2017

EMSC EQ Analysis - Oct 13th, 2017


By: Gordon Rutherford


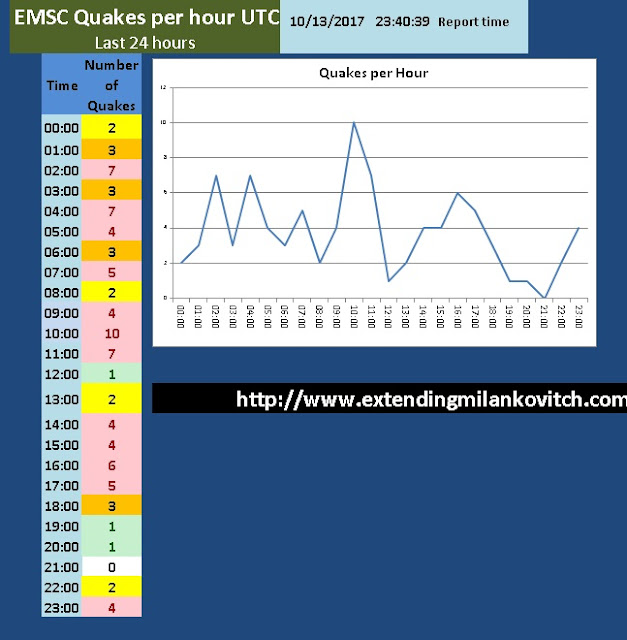
EMSC DATA downloaded
DATE 10/13/2017
TIME 23:40:39

Number of quakes >2.5m 90

Highest Magnitude Quake
Depth = 60km
Magnitude= 4.9m
UTC Time = 15:02:08
HALMAHERA, INDONESIA
Deepest Quake
Depth =  450km
Magnitude =  4.5m
UTC Time = 09:17:50
PAGAN REG., N. MARIANA ISLANDS

Geographic Quake Distribution

Magnitudes #
2.5m                 7
3m                  46
4m                  37
5m                 0
6m                 0
7m                 0
8m                 0
9 +                 0


Depth KM #
Surface 0-5 km 18
60         6-15 km 29
       16-25 km 13
Deep    26 - 50 km 11
30           51 - 99 km 9
        100 - 199 km 7
        200 - 299 km 1
        300 - 499 km 2
500 + 0


Epicenter Local Times Summarized
- Plotted to NASA JPL Data

Epicenter Magnetic Polarity
Totals Percentage
RED 57 63.33%
GREEN 20 22.22%
BLUE 13 14.44%

NOAA Geomagnetic Polarity Distribution


EMSC Data - Oct 13th, 2017

10/10/2017

EMSC EQ Analysis - Oct 10,2017


By: Gordon Rutherford


EMSC DATA downloaded
DATE 10/10/2017
TIME 23:55:47 UTC

Number of quakes >2.5m 108

Highest Magnitude Quake
Depth = 33
Magnitude = 6.7
UTC Time = 18:53:37
BOUVET ISLAND REGION
Deepest Quake
Depth = 218km
Magnitude = 4.4
UTC Time = 06:12:46
HALMAHERA, INDONESIA

Geographic Quake Distribution


Magnitudes #
2.5m 7
3m 74
4m 24
5m 1
6m 2
7m 0
8m 0
9 + 0


Depth KM #
Surface 0-5 km 17
57 6-15 km 30
  16-25 km        10
Deep 26 - 50 km 8
51 51 - 99 km 32
  100 - 199 km 10
  200 - 299 km 1
  300 - 499 km 0
                      500 +            0


Epicenter Local Times Summarized
- Plotted to NASA JPL Data


Epicenter Magnetic Polarity

Totals Percentage
       RED 67 62.04%
  GREEN 12 11.11%
     BLUE 29 26.85%


NOAA Geomagnetic Polarity Distribution


EMSC Data - Oct 10th, 2017

9/27/2017

EMSC Earthquake Analysis - September 27th, 2017


By: Gordon Rutherford


EMSC DATA downloaded
DATE 09/27/2017
TIME 23:30:16

Number of quakes >2.5m = 74

Highest Magnitude Quake
Depth =69
Magnitude = 5.3
UTC Time = 04:13:02
PAPUA, INDONESIA
Deepest Quake
Depth = 616km
Magnitude = 4.1m
UTC Time =16:08:08
FLORES SEA

Geographic Quake Distribution


Magnitudes #
2.5m                2
3m                  42
4m                  28
5m                  2
6m                  0
7m                  0
8m                  0
9 +                  0

               Depth KM #
Surface         0-5 km 20
38                6-15 km 11
                  16-25 km 7
Deep          26 - 50 km 14
36              51 - 99 km 8
                100 - 199 km 12
               200 - 299 km 0
               300 - 499 km 0
                       500 + 2


Epicenter Local Times Summarized
- Plotted to NASA JPL Data


NOAA Geomagnetic Polarity Distribution


              Epicenter Magnetic Polarity
        Totals Percentage
RED          43          58.11%
GREEN     16           21.62%
BLUE        15           20.27%


EMSC Data - Sept 27th, 2017