10/18/2017

M 6.0 - 100km SSE of Pangai, Tonga


By:  Gordon Rutherford

M 6.0 - 100km SSE of Pangai, Tonga

UTC  Time = 2017-10-18 12:00:59 
Magnitude = 6.0m
Location = 20.598°S   173.895°W 
Depth = 10.0 km

DRIVERS:
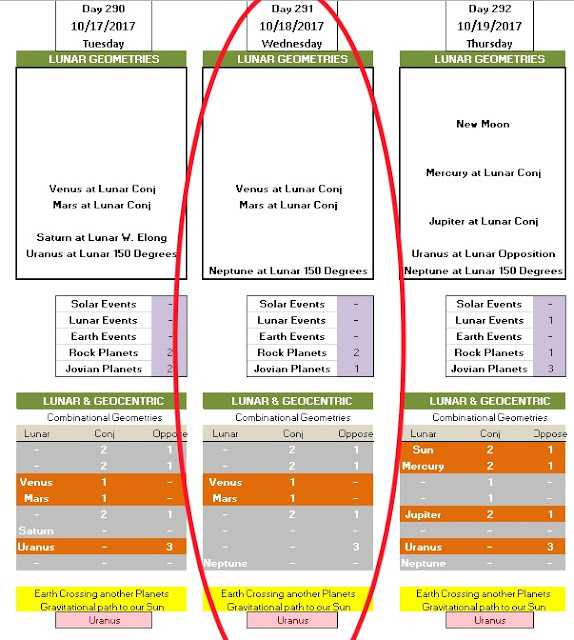
Approaching Lunar Opposition to Uranus
- Regional swapping occurring, Uranus not regular driver 

NOTES:
Uranus at Median (Epicenter Skyview)
Jupiter at Median (Antipodal Skyview)

Jupiter and Uranus at Geocentric Opposition


NOAA Geomagnetic Polarity (RED)

Epicenter Skyview

Antipodal Locations

Antipodal Skyview

NASA JPL Data

10/13/2017

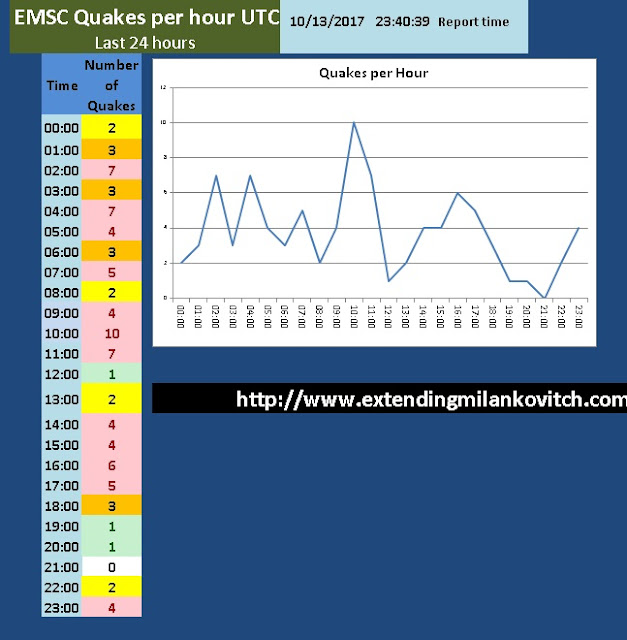
EMSC EQ Analysis - Oct 13th, 2017


By: Gordon Rutherford


EMSC DATA downloaded
DATE 10/13/2017
TIME 23:40:39

Number of quakes >2.5m 90

Highest Magnitude Quake
Depth = 60km
Magnitude= 4.9m
UTC Time = 15:02:08
HALMAHERA, INDONESIA
Deepest Quake
Depth =  450km
Magnitude =  4.5m
UTC Time = 09:17:50
PAGAN REG., N. MARIANA ISLANDS

Geographic Quake Distribution

Magnitudes #
2.5m                 7
3m                  46
4m                  37
5m                 0
6m                 0
7m                 0
8m                 0
9 +                 0


Depth KM #
Surface 0-5 km 18
60         6-15 km 29
       16-25 km 13
Deep    26 - 50 km 11
30           51 - 99 km 9
        100 - 199 km 7
        200 - 299 km 1
        300 - 499 km 2
500 + 0


Epicenter Local Times Summarized
- Plotted to NASA JPL Data

Epicenter Magnetic Polarity
Totals Percentage
RED 57 63.33%
GREEN 20 22.22%
BLUE 13 14.44%

NOAA Geomagnetic Polarity Distribution


EMSC Data - Oct 13th, 2017

10/10/2017

EMSC EQ Analysis - Oct 10,2017


By: Gordon Rutherford


EMSC DATA downloaded
DATE 10/10/2017
TIME 23:55:47 UTC

Number of quakes >2.5m 108

Highest Magnitude Quake
Depth = 33
Magnitude = 6.7
UTC Time = 18:53:37
BOUVET ISLAND REGION
Deepest Quake
Depth = 218km
Magnitude = 4.4
UTC Time = 06:12:46
HALMAHERA, INDONESIA

Geographic Quake Distribution


Magnitudes #
2.5m 7
3m 74
4m 24
5m 1
6m 2
7m 0
8m 0
9 + 0


Depth KM #
Surface 0-5 km 17
57 6-15 km 30
  16-25 km        10
Deep 26 - 50 km 8
51 51 - 99 km 32
  100 - 199 km 10
  200 - 299 km 1
  300 - 499 km 0
                      500 +            0


Epicenter Local Times Summarized
- Plotted to NASA JPL Data


Epicenter Magnetic Polarity

Totals Percentage
       RED 67 62.04%
  GREEN 12 11.11%
     BLUE 29 26.85%


NOAA Geomagnetic Polarity Distribution


EMSC Data - Oct 10th, 2017

9/27/2017

EMSC Earthquake Analysis - September 27th, 2017


By: Gordon Rutherford


EMSC DATA downloaded
DATE 09/27/2017
TIME 23:30:16

Number of quakes >2.5m = 74

Highest Magnitude Quake
Depth =69
Magnitude = 5.3
UTC Time = 04:13:02
PAPUA, INDONESIA
Deepest Quake
Depth = 616km
Magnitude = 4.1m
UTC Time =16:08:08
FLORES SEA

Geographic Quake Distribution


Magnitudes #
2.5m                2
3m                  42
4m                  28
5m                  2
6m                  0
7m                  0
8m                  0
9 +                  0

               Depth KM #
Surface         0-5 km 20
38                6-15 km 11
                  16-25 km 7
Deep          26 - 50 km 14
36              51 - 99 km 8
                100 - 199 km 12
               200 - 299 km 0
               300 - 499 km 0
                       500 + 2


Epicenter Local Times Summarized
- Plotted to NASA JPL Data


NOAA Geomagnetic Polarity Distribution


              Epicenter Magnetic Polarity
        Totals Percentage
RED          43          58.11%
GREEN     16           21.62%
BLUE        15           20.27%


EMSC Data - Sept 27th, 2017

Kiruna Magnetometer Analysis - Sept 27th, 2017


By:  Gordon Rutherford

03:14:59 UTC
Thursday, September 28, 2017

 Kiruna Magnetometer
- Periods of Influence
1)  Saturn at Lunar Conjunction (Moon Median)
2)  Neptune at Median

WEBSITE:

https://www.irf.se//Observatory/?link=Magnetometers

Period 1


Period 2

NASA JPL Data

Combinational Geometries


Heliocentric View

Celestial Geometries - September 27th, 2017


By:  Gordon Rutherford


15:38:51 UTC
Wednesday, September 27, 2017
.
**** VOLCANO WATCH IN EFFECT ***
*** NEXT 48 HOURS ***
.
Lunar Geometries
Apogee (Furthest from Earth)
Lunar Southern Standstill
Mercury at Lunar E. Elong
Saturn at Lunar Conj
Uranus at Lunar 120 Degrees
.
Combinational Geometries
- Mercury and Sun at Geocentric Conjunction
- Jupiter and Uranus at Heiocentric Opposition
- Saturn and Uranus at Heliocentric Opposition
.
Solar Magnetic Field 
Mercury (Dia-Magnetic) in the Negative
Mars (Para-Magnetic) in the Positive
Earth/Moon (Para-Magnetic) in the Positive 
.
NOTE: Mercury, Mars, and Sun WILL ALL BE AT THE SAME MAGNETIC POLARITY AND AT CONJUNCTION
.
VENUS NOT PLAYING MAGNETIC LINE BACKER TODAY

MERCURY and Sun Conjoined (WATCHOUT) when Mercury enters the Negative Rotating Solar MAgnetic Wind, as this will then Summarize with the Earth facing Positive Solar Magnetic wind. SINCE Mercury is Dia-Magnetic, when Mercury enters the Negative stream, then it will resonate POSITIVELY which will increase the Magnetic effect of the Moon and Sun at Eastern Elongation together.

Neap tide
There is low ocean tide today. Sun and Moon gravitational forces are not aligned, but meet at big angle, so their combined tidal force is weak.
.
Moon in apogee
Moon is reaching point of apogee today at 06:49, this is 13 days after last perigee on 13 September 2017 at 16:04 in ♊ Gemini. Lunar orbit is starting to get closer, while the Moon is moving inward the Earth for 11 days ahead, until it will get to the point of next perigee on 9 October 2017 at 05:51 in ♊ Gemini.
.
Moon before southern standstill (TOMORROW)
12 days after previous North standstill on 14 September 2017 at 13:00 in ♋ Cancer, when Moon has reached northern declination of ∠19.438°. Next day the lunar orbit moves southward to face South declination of ∠-19.516° in the next southern standstill on 28 September 2017 at 10:06 in ♑ Capricorn.


NASA JPL Data 
- Weekly Lunar Geometries
NASA JPL Data 
- Daily Lunar Geometries


NASA JPL Data 
- Daily Combinational Geometries

9/23/2017

EMSC Earthquake Analysis - 09/23/2017


By:  Gordon Rutherford

EMSC DATA downloaded
DATE 09/23/2017
TIME 23:46:34 UTC

Number of quakes >2.5m 
(Last 24 Hours)
= 75

Highest Magnitude Quake
Depth = 17 km
Magnitude = 6.1m
UTC Time = 12:53:02
OAXACA, MEXICO
Deepest Quake
Depth = 580 km
Magnitude = 4.4m
UTC Time = 00:28:53
FIJI REGION


Magnitudes #
2.5m                1
3m                   24
4m                   45
5m                   4
6m                   1
7m                   0
8m                   0
9 +                   0

Depth KM    #
Surface        0-5 km       6
42               6-15 km      25
                 16-25 km      11
Deep      26 - 50 km      13
33           51 - 99 km      11
             100 - 199 km     7
             200 - 299 km     1
             300 - 499 km     0
             500 km +           1


Geographic Distribution


UTC Times Converted to Epicenter Local Times


Local Times Summarized
- Plotted under NASA JPL Data


Epicenter Magnetic Polarity
Totals Percentage
 RED 46 61.33%
GREEN 16 21.33%
BLUE 13 17.33%


Geomagnetic Distribution


Summarized Local Times 
- Plotted by Magnetic Disposition


EMSC Data Downloaded for the Reports
- Sorted by Epicenter Local Times