6/19/2017

M 4.3 - 79km W of Campbell River, Canada


By:  Gordon Rutherford

M 4.3 - 79km W of Campbell River, Canada

UTC Time = 2017-06-19 17:22:55
Magnitude = 4.3m
Location = 49.971°N   126.351°W 
Depth = 1.0 km

Drivers:
Jupiter at Lunar Opposition (Antipodal Skyview)

Combinational Drivers:
- Moon in Neutral Rotating Solar Magnetic Field
- Uranus at Lunar Conjunction (Epicenter Skyview)
- Jupiter and Uranus at Geocentric Opposition


Epicenter Skyview

Antipodal Locations

Antipodal Skyview

NASA JPL Data

Solar Wind Data (Neutral Field)

M 5.8 - 139km WNW of Havelu, Tonga


By:  Gordon Rutherford

M 5.8 - 139km WNW of Havelu, Tonga
UTC Time = 2017-06-19 09:15:43
Magnitude = 5.8m
Location = 20.730°S   176.477°W 
Depth = 263.5 km

Drivers:
Jupiter at Lunar Opposition

Combinational Drivers:
- Uranus at Lunar Conjunction
- Jupiter and Uranus at Geocentirc Opposition to each other


Epicenter Skyview

Antipodal Locations

Antipodal Skyview


NASA JPL Data

6/17/2017

EMSC Earthquake Analysis - 06/17/2017


By:  Gordon Rutherford

EMSC DATA downloaded
DATE 06/17/2017
UTC TIME 23:25:13

Number of quakes >2.5m 65


NOTE:  Turkey Swarm included in ALL reports


Highest Magnitude Quake
Depth = 527
Magnitude = 5.4
UTC Time = 22:26:02
SOUTH OF FIJI ISLANDS
Deepest Quake
Depth = 527
Magnitude = 5.4
UTC Time = 22:26:02
SOUTH OF FIJI ISLANDS

Magnitudes #
2.5m          7
3m            43
4m               7
5m            8
6m            0
7m                 0
8m                 0
9 +                 0

Depth KM #
Surface 0-5           11
50                  6-15         38
                   16-25          1
Deep           26 - 50 2
15                51 - 99        6
                100 - 199 5
                200 - 299 1
                300 - 499 0
                    500 +         1

Geographic Quake Distribution

EMSC Local Times Summarized


NOAA Geomagnetic EQ Local Times 


Epicenter Magnetic Polarity
Totals Percentage
RED (52)       80.00%
GREEN (4)         6.15%
BLUE (9)       13.85%


NOAA Geomagnetic Earthquake Distribution


NASA JPL Data


EMSC Data and NASA JPL Data Local Times

EMSC Source Data

M 6.1 - South of the Fiji Islands


By:  Gordon Rutherford

M 6.1 - South of the Fiji Islands
UTC Time = 2017-06-17 22:26:02
Magnitude = 6.1m
Location = 24.105°S   179.591°E 
Depth = 518.2 km

Drivers:
Sun at Lunar Elongation (Last Quarter)
- Mars at Geocentric Conjunction w/ the Sun
- Moon in the Positive to Neutral Solar Magnetic Field


Epicenter Skyview


NOAA Geomagnetic Polarity


NASA JPL Data

NOAA Solar Wind Data

6/16/2017

M 4.5 - 13km NNE of West Yellowstone, Montana


By:  Gordon Rutherford

M 4.5 - 13km NNE of West Yellowstone, Montana
UTC Time = 2017-06-16 00:48:46
Magnitude = 4.5m
Location = 44.775°N   111.046°W
Depth = 9.4 km

Drivers:
Jupiter at 150 degrees from the Moon

Combinational Drivers:
Neptune at Lunar Conjunction (Antipodal Median)

Epicenter Skyview

Antipodal Locations

Antipodal Skyview

NASA JPL Data

NOAA Geomagnetic Polarity

6/15/2017

M 5.8 - Southern East Pacific Rise


By:  Gordon Rutherford

M 5.8 - Southern East Pacific Rise
UTC Time = 2017-06-15 11:42:15
Magnitude = 5.8m
Location = 55.414°S   124.789°W 
Depth = 10.0 km

Drivers:
Combinational Geometries
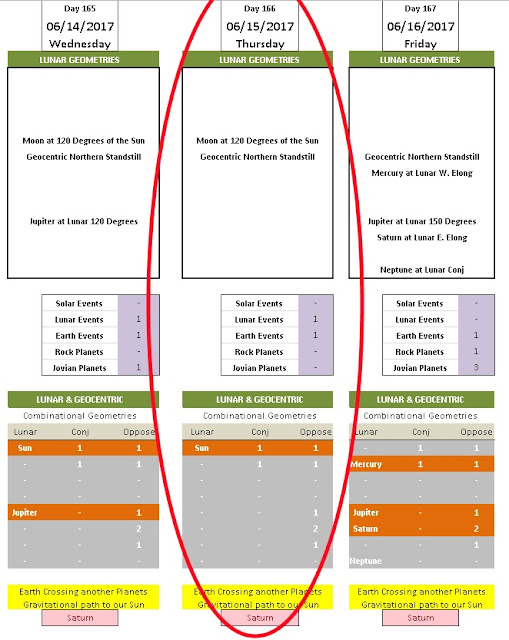
- Jupiter approaching 150 degrees from the Moon (Positive Magnetic Field)
- Sun at 120 degrees from the Moon (Resonating Negative Magnetic Field)
- Neptune at Lunar Conjunction (Negative Magnetic Field)

Epicenter Skyview

Antipodal Locations

Antipodal Skyview

NOAA Geomagnetic Polarity

NASA JPL Data

M 5.9 - 129km NE of L'Esperance Rock, New Zealand


By:  Gordon Rutherford

M 5.9 - 129km NE of L'Esperance Rock, New Zealand
UTC Time = 2017-06-15 00:26:16
Magnitude = 5.9m
Location = 30.562°S   177.997°W 
Depth = 23.6 km

Drivers:
Sun at 120 degrees from the Sun
- Negative to Neutral Solar Magnetic Field
- Earth crossing Saturns connected path to the Sun

Epicenter Skyview

Antipodal Locations

Antipodal Skyview

NOAA Geomagnetic Polarity

NASA JPL Data

Solar Magnetic Field

EMSC Earthquake Analysis - 06/15/2017


By: Gordon Rutherford

EMSC DATA downloaded
DATE 06/15/2017
UTC TIME 14:23:35

Number of quakes >2.5m 49


Highest Magnitude Quake
Depth = 20
Magnitude = 5.9
UTC Time = 00:26:14
KERMADEC ISLANDS, NEW ZEALAND
Deepest Quake
Depth = 223
Magnitude = 4.8
UTC Time = 09:54:32
POTOSI, BOLIVIA


Magnitudes #
2.5m                        7
  3m                           29
4m                           9
5m                           4
6m                           0
7m                           0
8m                           0
9 +                           0

Depth KM #
Surface 0-5           11
   40            6-15     24
                16-25        5
Deep        26 - 50         3
    9          51 - 99          1
              100 - 199        3
              200 - 299        2
              300 - 499        0
                    500 +        0


Time Conversions

Summarized Epicenter Quake times to NASA JPL Data

Quakes to NOAA Geomagnetic Polarity

NOAA Geomagnetic Quake Distribution

                     Epicenter Magnetic Polarity
            Totals Percentage
    RED     (35)     71.43%
GREEN     (4)        8.16%
    BLUE       (10)    20.41%

 NASA JPL Data